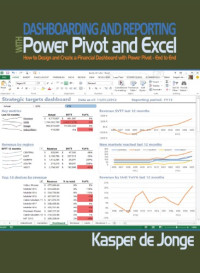
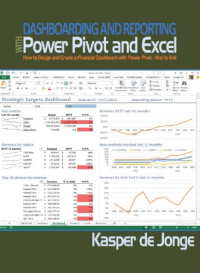
Dashboarding and Reporting with Power Pivot and Excel: How to Design and Create a Financial Dashboard with PowerPivot – End to End
Jonge, Kasper de
Microsoft’s revolutionary Power Pivot is a tool that allows users to create and transform data into reports and dashboards in new and much more powerful ways using the most-used analytical tool in the world: Excel.
This book, written by a member of Microsoft’s Power Pivot team, provides a practical step by step guide on creating a financial dashboard. The book covers in detail how to combine and shape the relevant data, build the dashboard in Excel, providing layout and design tips and tricks, prepare the model to work with fiscal dates, and show values used in many financial reports, including year-to-date, variance-to-target, percentage-of-total, and running totals reports.
Accessibly written, this book offers readers a practical, real-world scenario and can be used as a day-to-day reference. Though the guide focuses on Power Pivot for Excel 2010, a chapter that discusses Power View—compatible with Excel 2013— and Power BI is also included.
카테고리:
년:
2014
출판사:
Holy Macro! Books
언어:
english
페이지:
175
ISBN 10:
1615473394
ISBN 13:
9781615473397
파일:
EPUB, 17.79 MB
IPFS:
,
english, 2014
 Amazon
  Barnes & Noble
  Bookshop.org
  파일을 변환하실 수 있습니다
  더 많은 검색 결과
 기타 혜택
기타 혜택 


주로 사용되는 용어
연결된 도서 목록